

Temperature Rise
Record
High
Temperatures in 2014
Arctic News,
Arctic News,
19
January, 2015
The
year 2014 was the warmest year across global land and ocean surfaces
since records began in 1880, writes
NOAA,
adding the graph below. This graph illustrates that temperatures
have risen even when focusing on a relatively short recent period
with a linear trendline starting in 1998, which was an El Niño
year, whereas 2014 wasn't.
 |
|
Source: NOAA
Global Analysis - Annual 2014 |
Most
Appropriate Trendline
While the purple 1998-2014 trendline serves the useful purpose of dispelling the myth that warming had halted recently, it isn't the most appropriate trendline, since extending this trendline backward to 1880 would leave too many data too remote from the trendline, as is further illustrated by the animated image below.
While the purple 1998-2014 trendline serves the useful purpose of dispelling the myth that warming had halted recently, it isn't the most appropriate trendline, since extending this trendline backward to 1880 would leave too many data too remote from the trendline, as is further illustrated by the animated image below.

What about the blue linear trendline that is based on data for all the years from 1880 to 2014? By that same logic, the appropriateness of this trendline must also be questioned. Temperatures in recent years have been well above this trendline. A polynomial trendline seems a much better fit, as illustrated by the image below.

Above image also extends the trendline forward, showing that 2 degrees Celsius warming looks set to be exceeded in 2038, based on the same data.
And while this is a frightening scenario, the picture may well be much too optimistic, because the heat is felt most in the Arctic Ocean, the very location where some of the most terrifying feedbacks are accelerating local warming, as further explained below.
Feedbacks in the Arctic
As NOAA writes, much of the record warmth for the globe can be attributed to record warmth in the global oceans, which reached the highest temperature among all years in the 1880–2014 record.

As above image shows, ocean heat reached a record high in 2014. In other words, it was ocean heat that pushed the combined ocean and land temperature to a record high. Anomalies were especially high in the Arctic Ocean, as illustrated by the image below.

Waters close to Svalbard reached temperatures as high as 63.5°F (17.5°C) on September 1, 2014 (green circle). Note that the image below shows sea surface temperatures only. At greater depths (say about 300 m), the Gulf Stream is pushing even warmer water through the Greenland Sea than temperatures at the sea surface.
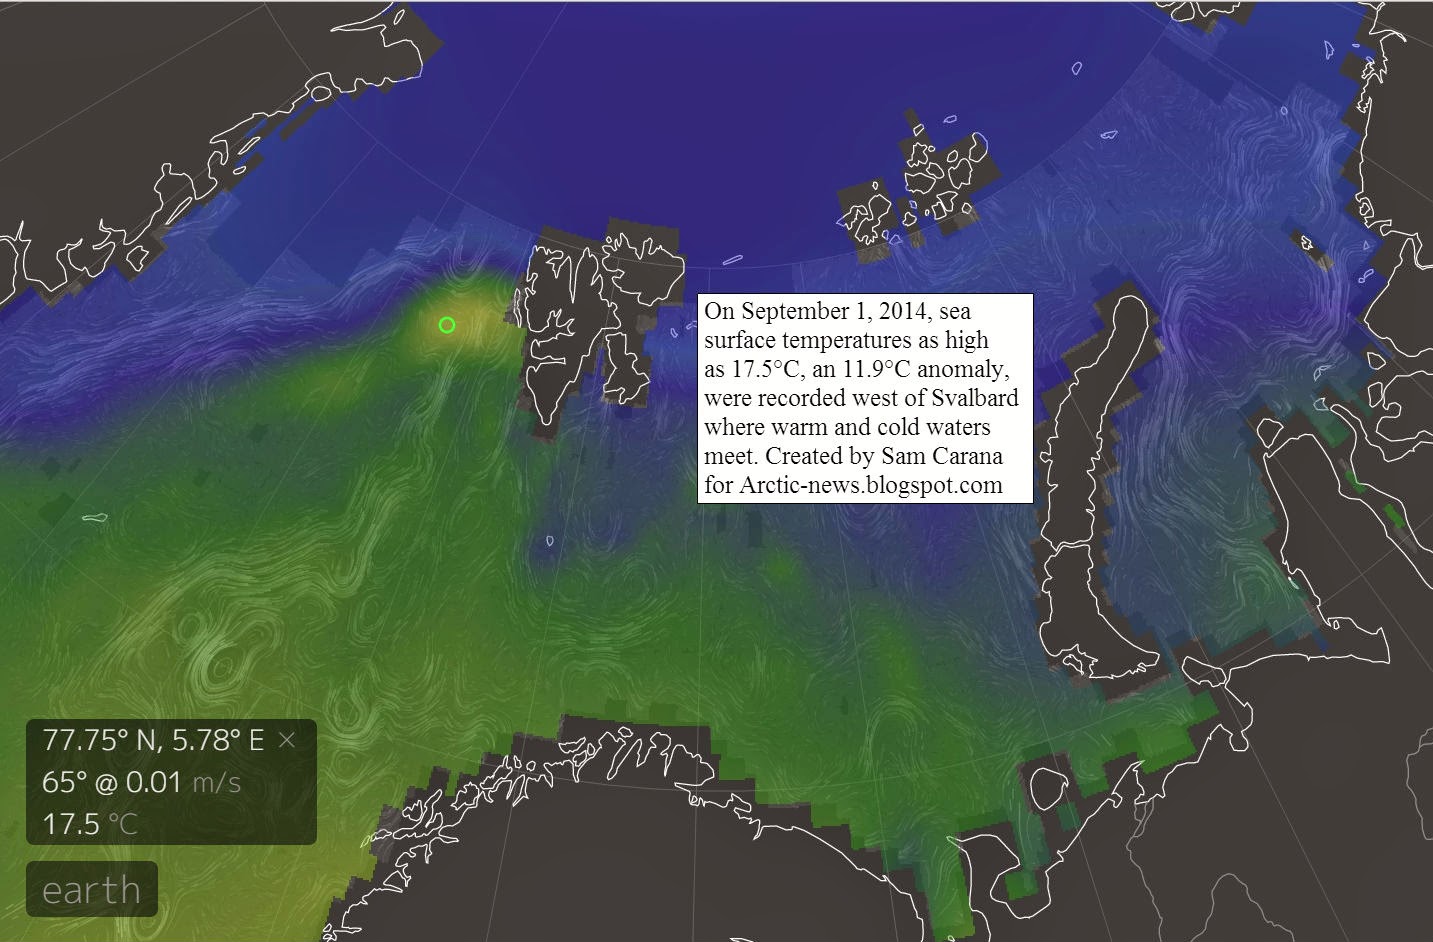
Since the passage west of Svalbard is rather shallow, a lot of this very warm water comes to the surface at that spot, resulting in an anomaly of 11.9°C. The high sea surface temperatures west of Svalbard thus show that the Gulf Stream can carry very warm water (warmer than 17°C) at greater depths and is pushing this underneath the sea ice north of Svalbard.
As the Gulf Stream keeps carrying ever warmer water into the Arctic Oceam, the threat is that huge amounts of methane will erupt from the seafloor of the Arctic Ocean over the coming decades, as illustrated by the image below.
 |
An exponential trendline based on sea ice volume observations shows that sea ice looks set to disappear in 2019, while disappearance in 2015 is within the margins of a 5% confidence interval, reflecting natural variability. In other words, extreme weather events could cause Arctic sea ice to collapse as early as 2015, with the resulting albedo changes further contributing to the acceleration of warming in the Arctic and causing further methane eruptions from the seafloor of the Arctic Ocean.
Demise of the sea ice and snow cover in the Arctic results in further acceleration of warming, not only due to less sunlight getting reflected back into space, but also due to loss of the buffer that currently absorbs huge amounts of heat as it melts in summer. With the demise of this latent heat buffer, more sunlight will instead go into heating up the water of the Arctic Ocean. For more on the latter, see the page on latent heat.

Above
image illustrates some of the self-reinforcing feedback loops that
have been highlighted in this and earlier posts. Further feedbacks
are pictured in the image below.
 |
|
from
the Feedbacks page |
Runaway
Global Warming
Above
feedbacks are already pushing the temperature rise in the Arctic
through the 2 degrees Celsius barrier. Based on existing temperature
data, global warming on land looks set to exceed 2 degrees Celsius
warming by the year 2034, but methane eruptions from the seafloor of
the Arctic Ocean could push up global temperature rise even faster,
in a runaway global warming scenario.
 |
|
|
This
raises the specter of human extinction. With no action taken, there
appears to be a 55% risk that humans will be extinct by the year
2045, while taking little action will only postpone near-term
human extinction by a few years. Only with rapid
implementation of comprehensive and effective action may we be able
to avoid this fate.

Comprehensive and Effective Action
In conclusion, the situation is dire and calls for comprehensive and effective action, as discussed at the Climate Plan blog at climateplan.blogspot.com and as illustrated by the image below.

I really like this valuable information and Thanks for sharing such great information. Please keep it up and I am waiting for new post here.
ReplyDeleteGlobal Warming Times