

Arctic
Sea Ice Flirts With New Record Lows Dragging Global Coverage
Inexorably Down
3
March, 2015
It’s
another winter of far above average temperatures for the Arctic.
Warm
air has risen — south to north — over both the North Atlantic and
Pacific. It has ridden through the Bering and Barents seas. And it
has invaded an Arctic sea ice pack that is far, far more fragile than
it has ever been in modern human reckoning.

(A parade of warm fronts predicted to run up through the North Atlantic and Barents between Greenland and Northern Europe and on up into the Arctic Ocean on Thursday, March 5. The warm fronts are indicated by regions of perpendicular wind flow across the meridional pattern running northward from the Eastern Seaboard of North America and on into the Arctic. It is a pattern we’ve seen frequently throughout the winter of 2014-2015. One that has resulted both in Arctic warming and extreme polar vortex excursions. Image source: Earth Nullschool. Data Source: Global Forecast Systems Model.)
The
winds have been fed by the warmest ocean surface temperatures ever
seen in the aftermath of the hottest year on record (2014). They have
pushed against ice packs off Irkutsk in Russia. They have driven ice
northward and melted it throughout the Bering. And they have pushed
10-20 foot waves against the ice along the coasts of Greenland, in
the Strait near Svalbard, and in the Barents west of Novaya Zemlya.
Near
Record Low Arctic Sea Ice
This
warm air influx has had a strong effect on the sea ice. Even in the
far north near the pole, sea ice has been occasionally observed to
thin this winter, reaching 80-90 percent concentration in a broad
patch just south of the pole. Marked thinning for an area from which
thicker, multi-year ice has undergone an extended retreat and 2 meter
thick ice is now the mainstay. A mere shadow of ice for a region that
once featured great hills and mounds of stable ice bounded by bridges
between the North American and Asian Continents.
Now,
over the greatly thinned and reduced ice, periods when temperatures
have neared or even exceeded the point at which sea ice melts (28 F)
have become more and more common in a broad wedge covering the Arctic
Ocean between Novaya and the pole itself. When combined with the warm
waters continuing to invade the Arctic Ocean from the flanks and from
below, it’s enough to have again pushed sea ice to near record low
extents for this time of year:
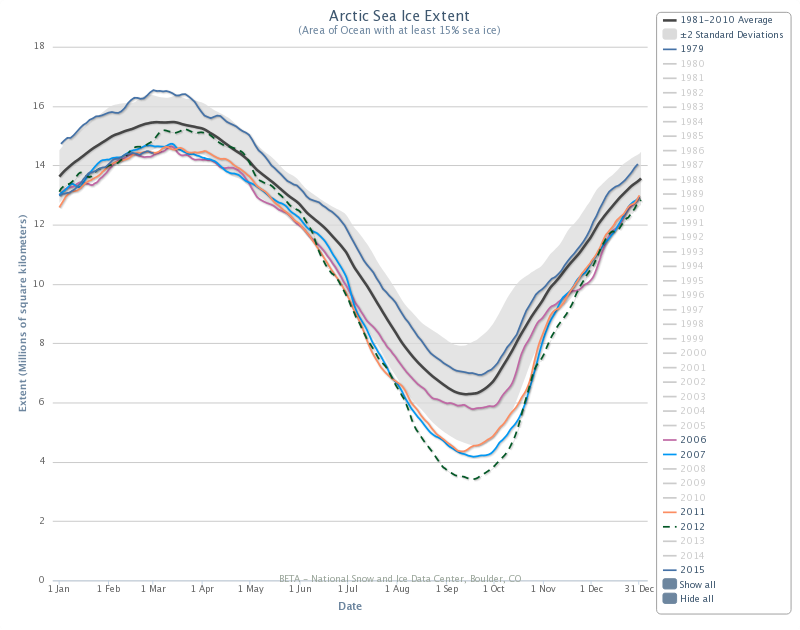
(Arctic sea ice extent for March 1 of 2015 shown by the purple line sandwiched between the orange line [2011] and the pink line [2006]. Yesterday’s sea ice extent was second lowest in the record with 2006 being the lowest and 2011 running in as third lowest for the date. 2012 [dotted green], 2007 [light blue] and 1979 [dark blue] were added for reference. Image source: NSIDC.)
At
the current measure of 14,450,000 square kilometers, that’s well
less than what we’ve seen during previous decades. More than
2,000,000 square kilometers, or about an area the size of Greenland,
less than 1979’s extent for March 1, for example.
And
the total could well go lower — testing new record ranges for early
March. For the Arctic is about to see another major influx of warm
air.
Starting
tomorrow and through Saturday, warm southerly winds will ride up into
both the Bering and through the Barents side of the Arctic Ocean east
of Novaya Zemlya. The warm air influx will be strongest through the
Barents region, pushing temperatures as warm as 30 F to withing 200
miles of the North Pole:


(Forecast for Wednesday finds 30 F temperatures riding up through the Barents and deep into the Arctic Ocean to within 200 miles of the North Pole. Note that similar temperatures appear in Ohio on the same day in the second frame. Image source: Earth Nullschool. Data source: Global Forecast Systems Model.)
For
comparison Ohio, many hundreds of miles to the south and well outside
the Arctic, will see the same reading at the same time. It’s
another major warm air influx that will again drive against the ice
pack. A continuation of a decades long assault that will bring with
it further threat of record lows in Arctic sea ice. One that could
set the 2015 melt season up for a rather low launching pad if the
major gains seen during this time of year in 2012, 2013, and 2014
don’t manage to materialize.
NASA
Study Finds 35,000 Square Kilometers of Sea Ice Lost Each Year
Globally
As
Arctic sea ice faces the potential for new all-time lows, a recently
released NASA study puts these losses in a global context.
This
important broader assessment shows that both Arctic sea ice loss and
global sea ice loss since 1979 has followed an unequivocal trend of
thinning and recession. This ongoing loss is despite the fact that
Antarctica has seen some minor gains in sea ice extent during that
same period.
“Even
though Antarctic sea ice reached a new record maximum this past
September, global sea ice is still decreasing. That’s because the
decreases in Arctic sea ice far exceed the increases in Antarctic sea
ice.”
A
graphic illustration of sea ice trends shows how rates of global and
Arctic decline compare when adding in the slight and far more gradual
sea ice gains occurring near Antarctica:

(NASA Polar Trend Graph shows Arctic, Antarctic, and combined global sea ice trends. Note the slight gain for Antarctica as compared to a precipitous fall for the Arctic even as the global trend shows a marked downswing. Image source: NASA.)
Massive
losses in the Arctic are likely due to the fact that the sea ice
there sits upon a warming ocean surrounded by warming continents. By
contrast, Antarctic sea ice sits in the Southern Ocean whose surface
waters are often cooled both by winds and by an increasing outflow of
cold, fresh water from the melting Antarctic glaciers. Factors that
serve as a minor surface counter-trend to the larger warming signal.
A signal, that for Antarctica, is driving an assault of warm water at
the ice sheets from the depth of hundreds of feet below the ocean
surface.
Overall,
the Arctic has lost of an average of 2 million square kilometers
since 1979. Antarctic gains of about 700,000 square kilometers are
enough to result in a global loss of around 1.3 million square
kilometers over the period. That’s equal to about 35,000 square
kilometers lost each year or an area the size of the State of
Maryland.
Finally,
it’s important to note that recent studies have shown (as hinted at
above) that sea ice gain around Antarctica is being driven by cold
water and ice berg outflows ramping up as the great glaciers of
Antarctica increase their melt rates. The melt, which is driven by a
pool of warm water expanding hundreds of feet beneath the ocean
surface and at the base of ice sheets and ice shelves is creating a
kind of heat conveyor which spreads cool water along the surface even
as it pulls more warm water in from underneath.
So
it appears even the slight ice gain for Antarctica has a connection
to human caused warming. One that is even more ominously linked to
an exponentially
ramping rate of land ice loss from Antarctica itself.
Links:
Hat
Tips:
Anna
Dnem
No comments:
Post a Comment
Note: only a member of this blog may post a comment.